There are no items in your cart
Add More
Add More
| Item Details | Price | ||
|---|---|---|---|

Exclusively created for FP&A, Finance Analyst & Reporting Analyst Professionals & Career Aspirants
The industry has changed. Using VLOOKUP for everything is no longer "Advanced Excel." It's the slow way.
Everything you need to go from "Beginner" to "Automated Reporting Expert."
If you are a beginner, you can start from the basics. Covers Excel UI, data entry, formatting, working with data, consolidation, and all Excel features for beginners
You will work with real MNC data set & solving real project analysis problems. 100+ scenarios to master functions, real reporting & dashboard problems
Build interactive, Access-Controlled Dashboards that use simple logics to build a dashboard that works based on user login & password
Start learning GL data consolidation, preparation, P&L building, sensitivity analysis & forecasting tools, and forecast scenario building
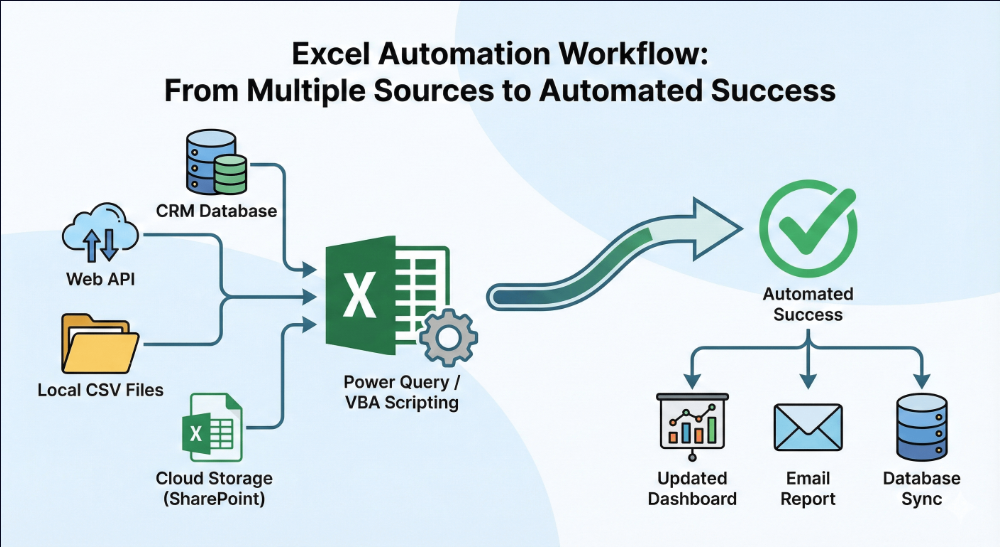
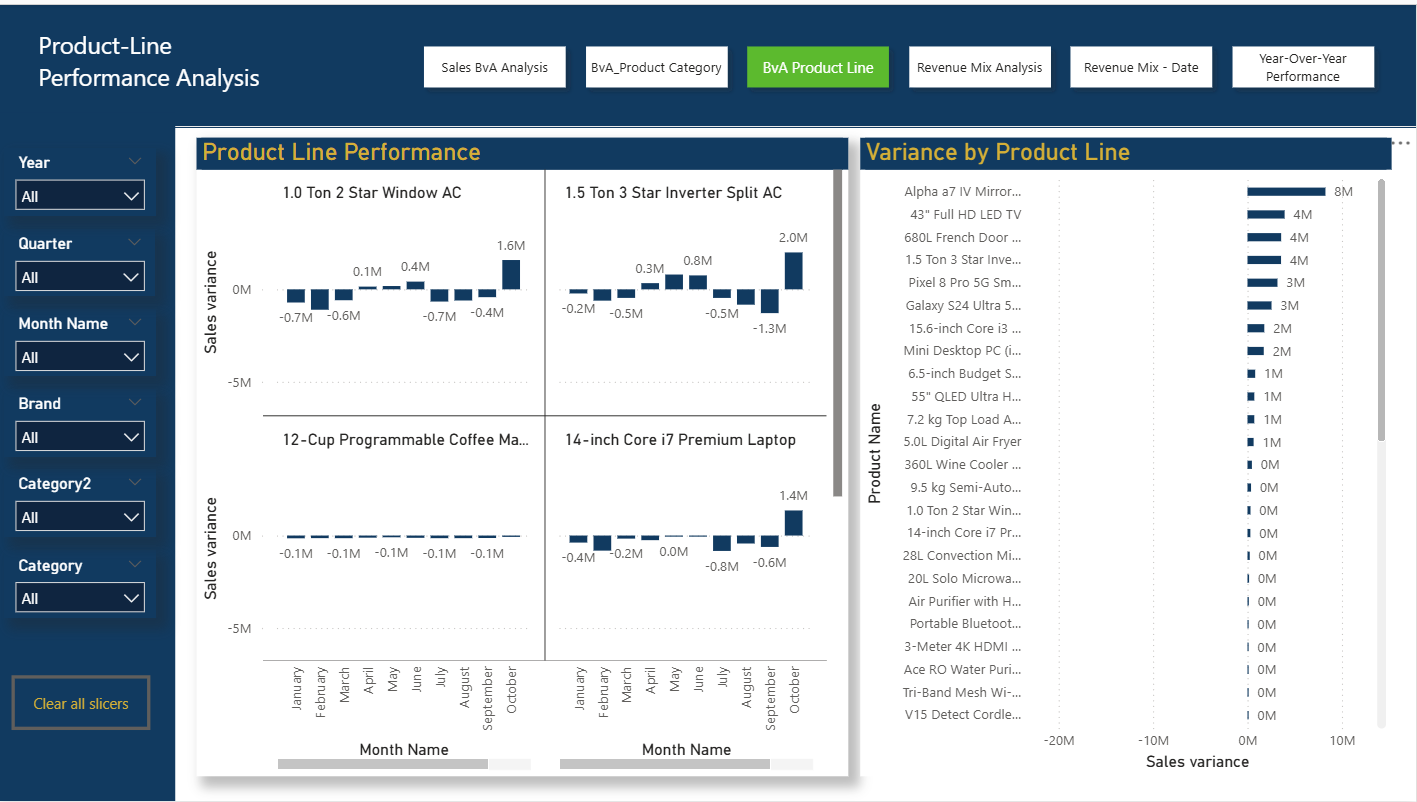
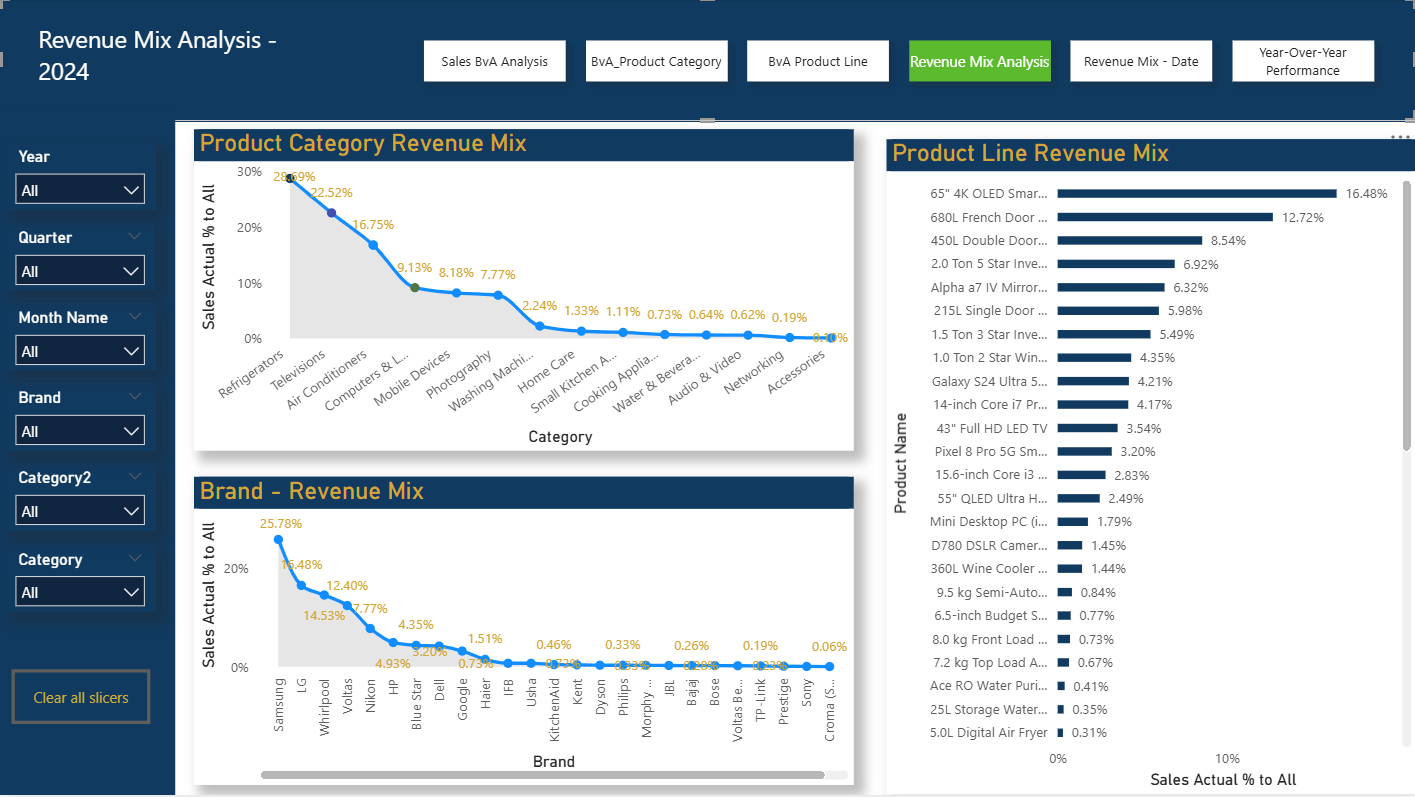
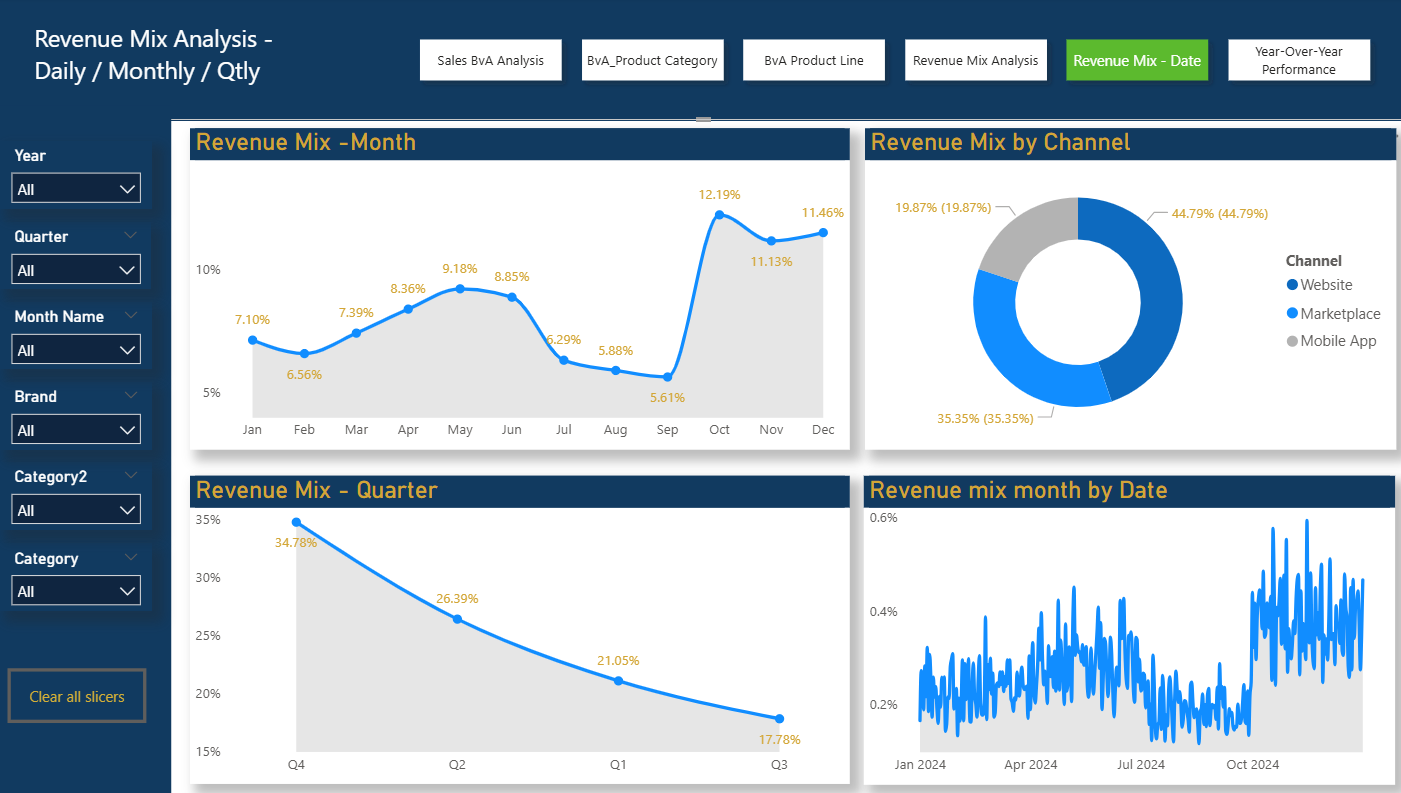
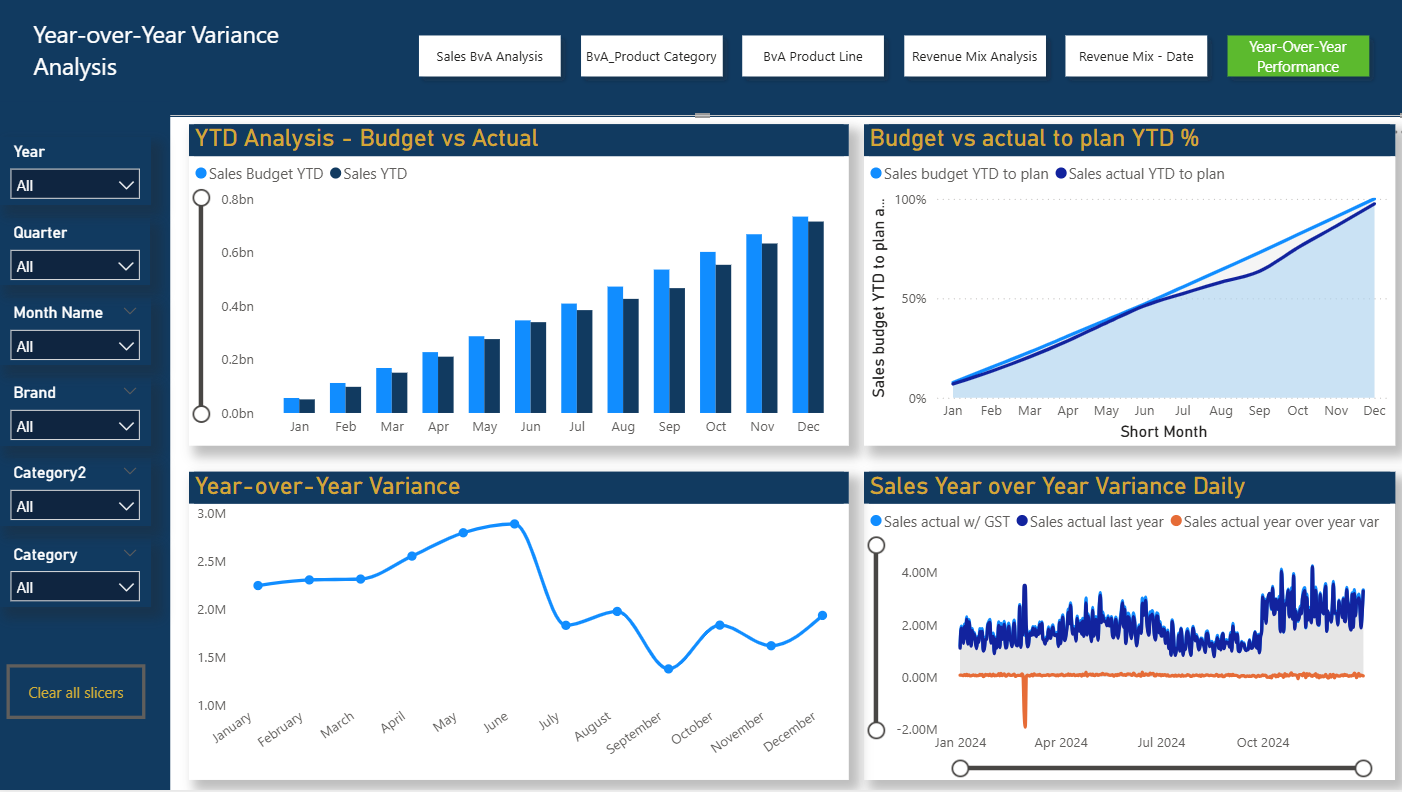
Learn the "One-Click Refresh" technique. Automate your entire reporting pack. Build P&L, Revenue Mix Analysis, PVM Analysis, EBITDA Improvement, Driver-Based dynamic forecasting. All automated
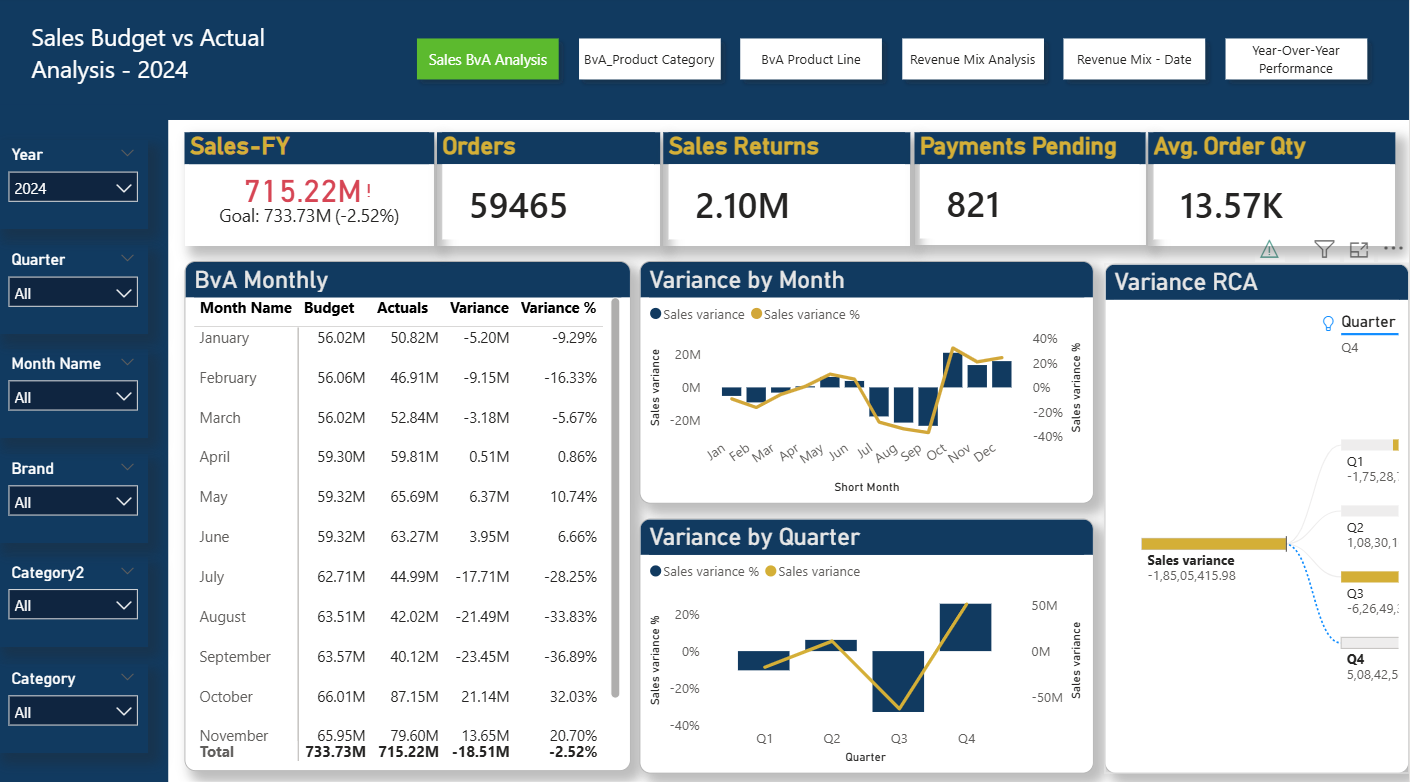
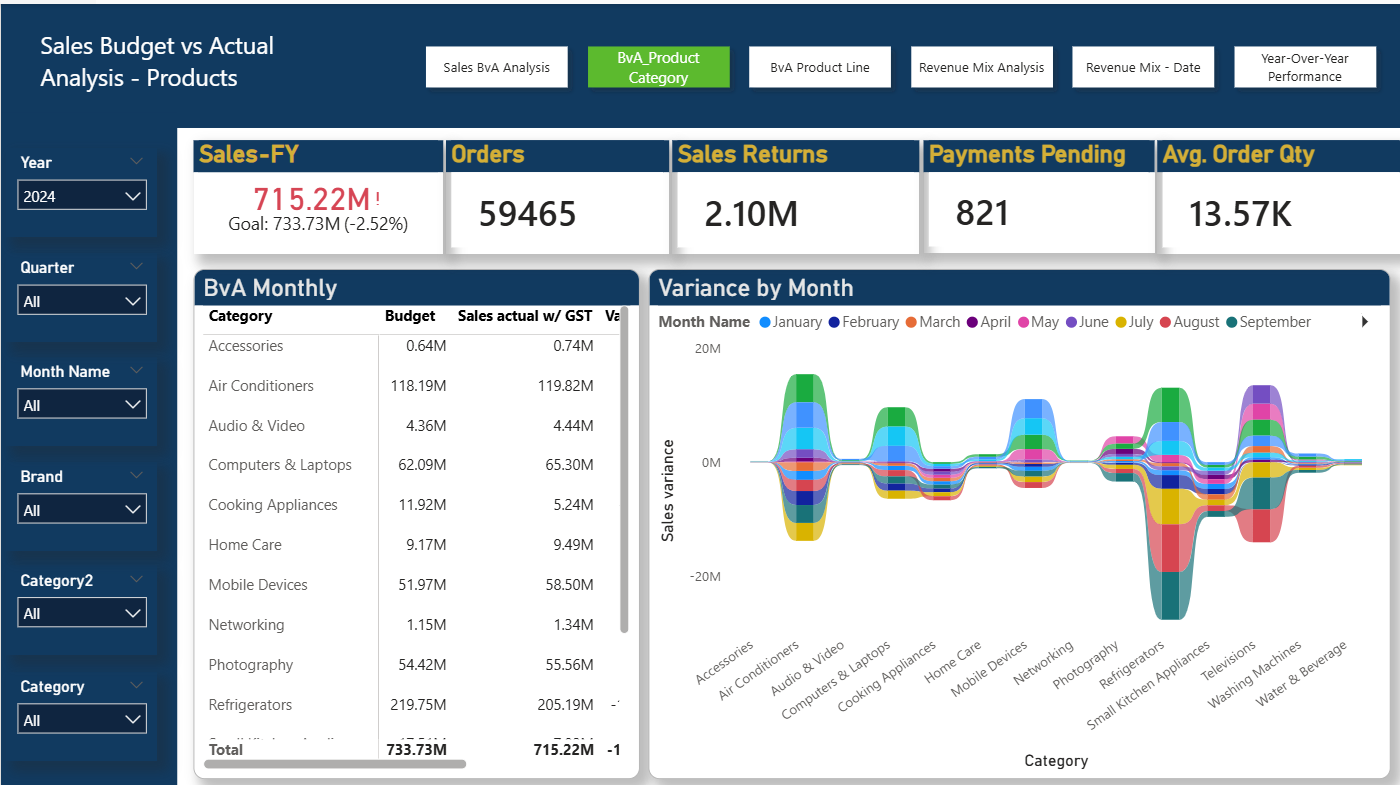
Don't stop at Excel. Learn to create stunning visuals and tell stories with data using Power BI.
This is where the magic happens. Join me live to implement everything you learned. You will learn both Excel Automation & Power BI Visualization to start confidently.
Includes: Doubt Clearing & Live Q&A.
Hi, I'm Sobhish. My journey began in 2005. I spent 19 years with two of the best MNCs, IBM and Genpact.
Most courses are taught by trainers who have never faced a month-end close pressure. I teach you the exact automation strategies I used to survive and thrive in the corporate world.
"I managed a commercial portfolio worth $60 Million USD annually. The Automation you will build in this course is the same one used to manage the complexities."
From Static Excel Spreadsheets, let's learn to build Power BI interactive visuals
Choose the plan that fits your learning style.
For those who want to learn on their own.
Fast Track Implementation with live session. A truly transformative Experience
Select the timing that works for you. Access is included in the Premium Plan.
Everything you need to know.
Both plans give you full access to the recorded content. The ₹2,499 Premium Plan includes 10 Days of LIVE Training, direct Q&A, and is focused on fast-track implementation.
Yes, absolutely. All live sessions are recorded and uploaded to your dashboard within 24 hours. (For Premium Plan students).
Currently, our course app supports Windows Laptops and Android Phones only. We are working on an iOS version.
Yes! Once you enroll, you get Lifetime Access to all the recorded videos, study materials, and updates.
We have a dedicated support system. You can ask questions in the Weekly Live Connect or use the "Ask a Doubt" form on the dashboard.
We offer a 7-Day Money Back Guarantee. If you feel the course is not adding value to your career, simply email us within 7 days for a refund.
It is simple. Please scroll up to the Pricing Section and click the "Enroll" button for your preferred plan. You will be redirected to the secure payment gateway.
Yes. The techniques and approach from basics to advanced can be applied to other domains like Operations, SCM and others
 Launch your Graphy

.jpg)